Shotoki - Relative V² IndexHi,
I share to you my Relative Volume/Volatility Index. They are 2 indicators in 1, but are calculated the same way. In purple we have the Relative Volume Index and in green the Relative Volatility Index
The RV²I is a ratio between a sum of the volume/volatility from a long period and the sum of the volume from a shorter period.
The shorter period has obviously less volume that's why we create a coefficient to make it relevant regarding the long and short period.
When the the RV²I is equal to 1 then the market is behaving as before.
We here more looking for rising up RV²I to anticipate big moves.
The lighter the Index is the more active the market is.
When the volume index is above the volatility one then the market is struggling to find trend.
When the volume index is below the volatility one then the market is more likely to have a trend, no struggle.
If you want to use only one of these I suggest you to use the purple one (volume). When it goes up then there are more volume in stake and that's where I'm looking for trades
You can use it at any timeframe.
Best regards, Shotoki
Поиск скриптов по запросу "relative volume"

Adaptive Ehlers Deviation Scaled Moving Average (AEDSMA)AEDSMA INTRODUCTION
This indicator is a functional enhancement to “Ehlers Deviation Scaled Moving Average (EDSMA / DSMA)”. I’ve used Volume Breakout and Volatility for dynamic length adaption and further Slope too for trend evaluation.
EDSMA was originally developed by John F. Ehlers (Stocks & Commodities V. 36:8: The Deviation-Scaled Moving Average).
IDEA PLACEMENT
I’ve traded almost every kind of market with different volatility conditions using Moving Averages. It was too much of a hassle to select and use different MA length depending upon market trend. So, the journey started with adapting Moving Averages with another parameter and that’s how “MZ SAMA ” came into being where Slope was used to adapt Adaptive Moving Average with trend change. The problem was still pretty much the same as SAMA might not be effective on every market condition. Hence, I worked on Volume to adapt Moving Averages accordingly. I cane up with “MZ RVSI ” which I used in “MZ DVAMA ” to adapt dynamic length in Adaptive Moving Average and also used “MZ RVSI " alongside Slope as confirmation of trend changes.
Meanwhile, I started using DVAMA methodology on different types on Moving Averages that allow dynamic length for example Hull Moving Average, Linear Regression Curve, SMA, WMA, TMA and many more. All of my tested Mas showed too much flexibility because of volume based Adaptive length.
I came across a script of “Adaptive Hull Moving Average” which pretty much used the similar methodology as DVAMA but when I looked into its depth, its volume oscillator wasn’t working at all and only volatility based dynamic length was used. It was an interesting idea so, I decided to use Volume and Volatility alongside for better results but was nearly impossible to achieve what I wanted using only Hull Moving Average.
I had been using EDSMA in “MA MTF Cross Strategy” and “MZ SRSI Strategy V1.0” previously. It was the perfect choice when comparing to usage of slope on it. DSMA works perfectly as support and resistance as its Deviation Scaled. So, I tried using it to adapt dynamic length based on Volume and Volatility and I wasn’t disappointed. It worked like a charm when I adapted dynamic length between 50 and 255.
DYNAMIC LENGTH BENEFITS
Dynamic length adaption methodology works in a way of adapting Relatively Lower Length leading toward overfitting if trend is supported by Volume and Volatility . Similarly, adapting Relatively Higher Length leading toward underfitting if trend isn’t supported by Volume and Volatility .
Dynamic length adaption makes Moving Average to work better for both Bull and Bear-runs avoiding almost every fake break-in and breakouts. Hence, adaptive MA becomes more reliable for breakout trading.
MA would be more useful as it would adapt almost every chart based on its Volume and Volatility data.
DYNAMIC COLORS AND TREND CORRELATION
I’ve used dynamic coloring to identify trends with more detail which are as follows:
Lime Color: Strong Uptrend supported by Volume and Volatility or whatever you’ve chosen from both of them.
Fuchsia Color: Weak uptrend only supported by Slope or whatever you’ve selected.
Red Color: Strong Downtrend supported by Volume and Volatility or whatever you’ve chosen from both of them.
Grey Color: Weak Downtrend only supported by Slope or whatever you’ve selected.
Yellow Color: Possible reversal indication by Slope if enabled. Market is either sideways, consolidating or showing choppiness during that period.
SIGNALS
Green Circle: Market good for long with support of Volume and Volatility or whatever you’ve chosen from both of them.
Red Circle: Market good to short with support from Volume and Volatility or whatever you’ve chosen from both of them.
Yellow Cross: Market either touched top or bottom ATR band and can act as good TP or SL.
EDSMA EVELOPE/BANDS: I’ve included ATR based bands to the Adaptive EDSMA which act as good support/resistance despite from main Adaptive EDSMA Curve.
DEFAULT SETTINGS
I’ve set default Minimum length to 50 and Maximum length to 255 which I’ve found works best for almost all timeframes but you can change this delta to adapt your timeframe accordingly with more precision.
Dynamic length adoption is enabled based on both Volume and Volatility but only one or none of them can also be selected.
Trend signals are enabled based on Slope and Volume but Volatility can be enabled for more precise confirmations.
In “ RVSI ” settings TFS Volume Oscillator is set to default but others work good too especially Volume Zone Oscillator. For more details about Volume Breakout you can check “MZ RVSI Indicator".
ATR breakout is set to be positive if period 14 exceeds period 46 but can be changed if more adaption with volatility is required.
EDSMA super smoother filter length is set to 20 which can be increased to 50 or more for better smoothing but this will also change slope results accordingly.
EDSMA super smoother filter poles are set to 2 because found better results with 2 instead of 3.
FURTHER ENHANCEMENTS
So far, I’ve seen better results with Volume Breakout and Volatility but other parameters such as Linear Slope of Particular MA, MACD, “MZ SRSI ”, a Conditional Uptrend MA or simply KDJ can also be used for dynamic length adaption.
I haven't yet gotten used to pine script arrays so, defining and using conditional operators is pretty much lazy programming for me. Would be great redefining everything through truth matrix instead of using if-else conditions.

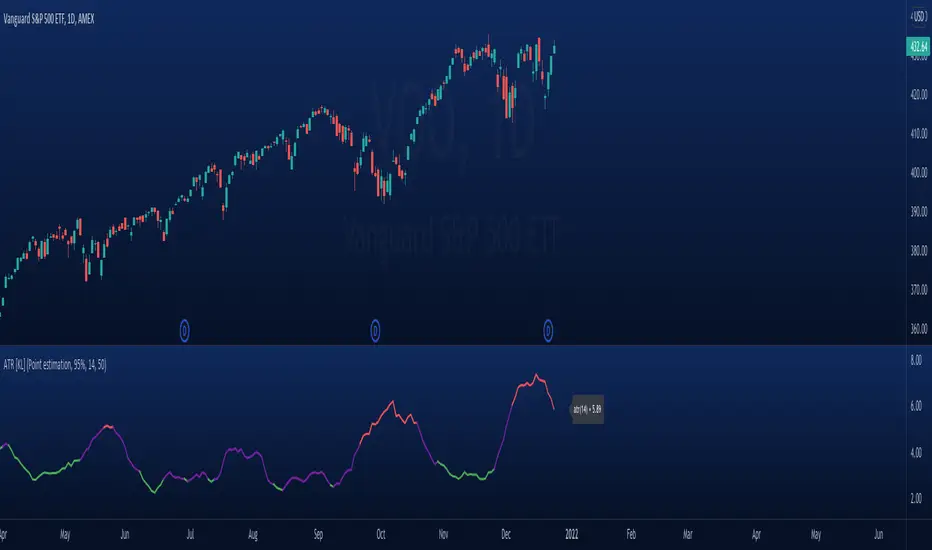
Modified ATR Indicator [KL]Modified Average True Range (ATR) Indicator
This indicator displays the ATR with relative highs and relative lows statistically determined.
What is ATR:
To know what ATR is, we need to understand what a True Range (TR) is.
- TR at a given bar is the highest distance between points: a) High vs low, b) High vs Close, and c) Low vs Close.
- ATR is the moving average of TRs over a predefined lookback period; 14 is the most commonly used.
- ATR can be mathematically expressed as:
Why is ATR Important
ATR often used to measure volatility; high volatility is indicated by high ATR, vice versa for low. This is a versatile tool allowing traders to determine entry/exit points, as well as the size of stop losses and when to take profits relative to it.
This is an opinion: Through observations, I have noticed that ATR can also indirectly tell us the levels of relative volume. This intuitively makes sense because in order to increase length of TR, high amounts of capital inflow/outflow is required (graphically speaking, high volume is required in order to make lengths of candle sticks longer). The relationship between ATR and relative volume should hold unless the market is illiquid to the extreme that there is no relationship between volume and price.
That said, knowing the relative lows/highs of ATR is very useful. It can be interpreted as:
- Relative high = high volatility, usually during sell offs
- Relative low = decreasing volume, could indicate price consolidation
Instead of arbitrarily determining whether ATR is high/low, this indicator will determine relative highs and relative lows using a simple statistical model.
How relative high/low is determined by this model
This indicator applies two-tailed hypothesis testing to test whether ATR (ie. say lookback of 14) has greatly deviated from a larger sample size (ie. lookback of 50). Assuming ATR is normally distributed and variance is known, then test statistic (z) can be used to determine whether ATR14 is within the critical area under Null Hypothesis: ATR14 == ATR50. If z falls below/above the left/right critical values (ie. 1.645 for a 90% confidence interval), then this is shown by the indicator through using different colors to plot the ATR line.
TraderLion’s Enhanced VolumeTraderLion’s Enhanced Volume has the following features highlighted below.
1. High Relative Volume Bars: Clearly highlight high relative volume bars with a high closing range lime green for the best interpretation of volume on your Daily & Weekly Charts.
2. Low Relative Volume Bars: Clearly labels low relative volume days with a down arrow to interpret constructive price & volume action on your Daily & Weekly Charts.
3. Volume Labels: High volume days are labeled to show 2 things: Total shares traded and Percent above average
4. Highest Volume in Over a Year: Look for the letters HV on top of the volume bar to identify this powerful characteristic.
5. Simple Moving Average: SMA overlay on your volume without taking up limited indicator slots.
6. High Relative Volume Alerts: Set alerts that trigger when the volume surpasses the High Relative Volume Threshold.
Suggestions for additions and tweaks? Comment below!

(JS) Ultimate RSISo my goal here was to combine all of my RSI ideas into a single indicator in order to make kind of a "Swiss Army Knife" version of the Relative Strength Index ...
------------------------------------------------------------------------------------------------------------------------------------------------------------------------------------------------------------------------------------------------------------------
So, let's begin with the first RSI indicator I made, which is the RSIDVW (Divergence/Volume Weighted);
To rephrase my original post, the "divergence/volume weighted" portion is meant to expand upon the current RSI format by adding more variables into the equation.
The standard RSI is based off one value that you select (open, close, OHLC4, HLC3, etc.) while this version takes three variables into account.
The default setting is to have RSI normal without anything added to it (Divergence Weight = 0)
1st - it takes the standard variable that RSI normally uses.
2nd - it factors RSI divergence by taking the RSI change % and price change % to form a ratio. Using this ratio, I duplicated the RSI formula and created a divergence RS to be factored in with the standard price RS .
3rd - it takes Relative Volume and amplifies/weakens the move based upon volume confirmation. (So if Relative Volume for a price bar is 1.0, the RSI plot would be the same as it normally would)
So to explain the parameters
- Relative Volume Length: This uses the RV length you specify to determine spikes in volume (or lack of volume ), which then is added into the formula to influence the strength of the RSI move
- RV x Divergence: This is how I calculated the original formula, but you can leave this unchecked to turn Relative Volume off, or apply elsewhere.
- RV x RS: There's two sides, Divergence RS and Standard RS - these check marks allow you to select which part you prefer to be multiplied by Relative Volume .
Checking neither turns off Relative Volume , while checking both amplifies its effects by placing it on both sides of the equation.
-Divergence Weight: This controls how much the DVW portion of the formula influences the RSI plot. As I referred to earlier, default is 0 making RSI normal. The Scale is 0-2, so 1.0 would be the same as 50%.
When I do have DVW on, I generally set it to 0.5
-SMA Divergence: To smooth, or not to smooth, that is the question. UJsing an SMA here is much smoother in my opinon, but leaving it unchecked runs it through an RMA the same way standard RSI is calculated.
-Show Fractal Channel: This allows you to see the whole fractal channel around the RSI (This portion of the code, compliments of the original Ricardo Santos fractal script)
------------------------------------------------------------------------------------------------------------------------------------------------------------------------------------------------------------------------------------------------------------------
The next portion of the script is adding a "Slow RSI"...
This is rather simple really, it allows you to add a second RSI plot so that you can watch for crossovers between fast and slow lines.
-Slow RSI: This turns on the second RSI Plot.
-Slow RSI Length: This determines the length of the second RSI Plot.
------------------------------------------------------------------------------------------------------------------------------------------------------------------------------------------------------------------------------------------------------------------
Pivot Point RSI was something a friend of mine requested I make which turned out pretty cool, I thought... It is also available in this indicator.
-Pivot Points: Selecting this enables the rest of the pivot point related parts of the script
If Pivot Points isn't selected, none of the following things will work
-Plot Pivot: Plots the pivot point .
-Plot S1/R1: Plots S1/R1.
-Plot S2/R2: Plots S2/R2.
-Plot S3/R3: Plots S3/R3.
-Plot S4/R4: Plots S4/R4.
-Plot S5/R5: Plots S5/R5.
-Plot Halfway Points: Plots a line between each pivot .
-Show Pivot Labels: Shows the proper label for each pivot .
When using intraday charts, from a 15 minute interval or less the pivots are calculated based on a single days worth of price action, above that the distance expands.
Here are the current resolutions Pivot Points will work with:
Minutes - 1 , 2, 3, 5, 10, 13, 15, 20, 30, 39, 78, 130, 195
Hours - 1, 2, 3, 4, 5, 6
Daily
Weekly
Currently not available on seconds or monthly
------------------------------------------------------------------------------------------------------------------------------------------------------------------------------------------------------------------------------------------------------------------
Background Colors
Background Colors: I have six color schemes I created for this which can be toggled here (they can be edited).
Gray Background for Dark Mode: Having this on looks much better when using dark mode on your charts.
------------------------------------------------------------------------------------------------------------------------------------------------------------------------------------------------------------------------------------------------------------------
Now finally the last portion, Fibonacci Levels
-Fibonacci Levels: This is off, by default, which then uses the standard levels on RSI (30-50-70). When turned on, it removes these and marks fib levels from 0.146 through 0.886.
------------------------------------------------------------------------------------------------------------------------------------------------------------------------------------------------------------------------------------------------------------------
So the quick rundown:
Ultimate RSI contains "divergence/volume weighted" modifications, a slow RSI plot, pivot points , and Fibonacci levels all while auto-plotting divergence and having the trend illustrated in the background colors.
RSI has always been my "go to" indicator, so I hope you all enjoy this as much as I do!

Volume+ (RVOL By Time of Day)This script is an enhanced volume indicator.
It calculates relative volume (RVOL) based on the average volume at that time of day (rather than using a moving average).
For example, using this indicator you can see today’s volume during the first 5-minute candle of the market open compared to the previous day’s volume at the market open. Or you can see today’s volume at the market close during the last 15-minute candle compared to the average of the past 20 days of volume at the market close.
Due to the different quantity of candlesticks in a session between Stocks and Forex/Crypto, I separated those markets into separate settings, making this an all-in-one volume indicator that works on all markets.
Settings:
Stocks
If you set the lookback period to 1 on the 5-minute chart and look at the 9:30am candle for a stock, then the current volume bar will show you what today’s volume is compared to yesterday’s 9:30am 5-minute candle.
If you set the lookback period to 15, then the current volume bar will show you what today’s volume is compared to the average of the last 15 days of 9:30am 5-minute candles.
Max Lookback: 64 Sessions
Stocks
This setting is for traders who want to use this indicator on a timeframe lower than the 5-minute chart.
Due to limitations in how many historical bars PineScript can reference, referencing 1-minute and 3-minute bars requires a lot more historical data so I separated the two to allow the 5-minute+ timeframes to have a longer lookback period.
Max Lookback: 12 Sessions
Forex/Crypto
When you set the script to Forex/Crypto, it does the same thing for stocks but calculates based on a 24-hour period.
So if you set the lookback period to 1 on the 1-hour chart and look at the 11:00am candle for a currency pair, then the current volume bar will show you what today’s volume is compared to yesterday’s 11:00am 1-hour candle.
If you set the lookback period to 10, then the current volume bar will show you what today’s volume is compared to the average of the last 10 days of 11:00am 1-hour candles.
Max Lookback: 17 Sessions
What Doesn’t It Work On?
Because I had to manually calculate how many volume candles to look back per timeframe to get the previous session’s candle, I had to hard-code the math in this script.
That means that this indicator will only work on 1m, 3m, 5m, 15m, 30m, 45m, 1h, 2h, 3h, 4h, Daily and Weekly timeframes. If you try to use it on any other timeframe it will revert to a regular volume indicator.
Why Is It Useful?
Similar to volume profile by price, this gives you a volume profile by time in a way that the default volume indicator does not.
For example, you can use this to determine when a stock has a particularly strong opening drive, or when a currency pair has a weak fake-out leading up to the London open, or for general confirmation on trading signals with time-specific volume information to work with.
Colors
The purple line and the faint gray bar is the RVOL value.
The blue number is the percentage of the current volume bar relative to RVOL.
There are four different bar color settings:
Heatmap – Changes color to be brighter based on higher RVOL
Price – Changes color based on price action (like the default TradingView volume indicator)
Traffic – Changes color based on RVOL percentages (for fast visual cues)
Trigger – Changes color only when the specified alert conditions are met
Heatmap:
Traffic:
Trigger:
Price:
Heatmap:
Turns very bright green at 2.0 RVOL
Turns light green at 1.0 RVOL
Turns normal green at 0.75 RVOL
Turns medium green at 0.5 RVOL
Turns very dark green at 0.25 RVOL
Is gray otherwise.
Price:
Turns red if the price action candle closed bearish.
Turns green if the price action candle closed bullish.
Traffic:
Turns red if RVOL is between 1.0 and 1.5.
Turns orange if RVOL is between 1.5 and 2.0.
Turns dark green if RVOL is between 2.0 and 3.0.
Turns bright green if RVOL is above 3.0.
Is gray otherwise.
Trigger:
Turns teal if any of the given alert conditions in the user settings are met.
Alerts
Alerts are optional. You have to set them like any other indicator, by creating a new alert and selecting this indicator.
If you leave the "Alert At RVOL %" setting at 0, then alerts will only be triggered if the current candle exceeds the 1.0 (100%) RVOL level.
If you change the "Alert At RVOL %" setting then alerts will be triggered if the RVOL percentage (blue number) exceeds your given value. The blue number is a percentage of the average, so if it’s at 0.5, then it’s 50% of the average.
Notes
- This indicator only works with regular time bars. It will not work with range, tick, renko etc.
- This script has lookback limitations due to restrictions on how many historical bars PineScript can reference. The lookback limit varies based on the market type you choose. The more bars required for calculation the lower the lookback limit.
- If you use it on the Daily timeframe the lookback period will count as 1 week. If you use it on the Weekly timeframe the lookback period will count as 1 month. So a Lookback of 3 on the Daily would be 3 weeks of averages, a Lookback of 5 on the Weekly would be 5 months of averages (for that Day of Week or Week number).
- Big thanks to @tb12345 for the idea and for helping to field-testing the indicator!

#101c Volume Data Overlay - Alert [bionis]Indicator #101c is a surrogate of my original #101 volume based indicator. With this version is now possible to set alerts for specific levels of relative volume.
Access is granted to CryptoSociety Team and their community.

(JS) RSI Divergence Volume Weighted (v1.0)This indicator is meant to expand upon the current RSI format by adding more variables into the equation. The standard RSI is based off one value that you select (open, close, OHLC4, HLC3, etc.) while this version takes 3 variables into account. 1st - it takes the standard variable that RSI normally uses. 2nd - it factors RSI divergence into the plot by taking the RSI movement % and price movement % to form a ratio. Using this ratio, I duplicated the RSI formula and created a divergence RS to be factored in with the standard price RS. And finally, the 3rd variable is Relative Volume (which I have made adjustable). When calculating for the average up and average down numbers needed to form RS in the original equation, this indicator multiplies the appropriate average based on if it's a green or red day (going into the divergence RS, not the original one). On green days, the green average is multiplied by the relative volume, and on red days, the red average is multiplied by relative volume. What this does, is add to moves with confirmation volume and make moves on no volume weaker - rendering a more precise and effective result. I plan on adding to this, but this is my 1st indicator I've published, so Ihope you enjoy it.

Parabolic Move Indicator for catching moves with Penny Stocks.
Catch the day’s first big moves! Track premarket gap-ups or gap-downs, then spot early momentum shifts using volume, RSI, VWAP, EMAs, and breakout levels—perfect for acting on strong intraday setups right at market open.
**Description:**
The Parabolic Move Scanner + VWAP Bands + EMAs indicator helps traders identify **high-probability intraday moves**, particularly immediately after market open. It is ideal for stocks that **gap up or down premarket, pull back slightly, and then show renewed strength or weakness** once regular trading begins.
The indicator combines multiple components for precise signals:
* **Relative Volume Filter: ** Highlights bars with unusually high activity to ensure signals are backed by real participation.
* **RSI Momentum Change: ** Detects sudden momentum shifts to identify early strength or weakness.
* **Recent Highs/Lows Breakout: ** Confirms price is breaking short-term resistance or support.
* **VWAP & Standard Deviation Bands: ** Provides intraday trend reference points, with optional daily reset.
* **Exponential Moving Averages (EMAs): ** Tracks trend across short, medium, and long-term intraday periods.
* **Visual Signals: ** Background highlights and horizontal breakout lines make it easy to spot key bars.
* **Alerts: ** Configurable alerts notify you of bullish or bearish parabolic moves.
**Optimal Use Case: **
Use in the first 15–30 minutes after market open at 1 minute Time Frame. Best for **stocks showing a premarket gap followed by a pullback**, then resuming strength (bullish) or weakness (bearish). The combination of **volume, RSI, breakouts, VWAP, and EMAs** ensures you identify the **day’s biggest marktet open moves especially with penny stocks moves** with higher confidence.
---
### **Recommended Settings**
**Component** | **Recommended Setting** | **Description / Purpose**
| **Volume Average Length** | 20 bars | Period for calculating average volume to detect relative spikes. |
| **Volume Multiplier** | 2.0 | Current bar volume must exceed 2× average to signal high activity. |
| **RSI Length** | 7 bars | Short-term RSI period to measure momentum changes. |
| **RSI Change Threshold** | 7 | Minimum RSI change required to trigger momentum signal. |
| **Recent Highs Lookback** | 5 bars | Number of bars to check for short-term breakout levels. |
| **Horizontal Line Length** | 10 bars | Length of horizontal breakout line drawn on the chart. |
| **Horizontal Line Color** | Green (bullish) / Red (bearish) | Visual identification of breakout levels. |
| **Horizontal Line Thickness** | 1 | Line width for breakout visualization. |
| **VWAP Source** | hlc3 | Price source for VWAP calculation. |
| **VWAP Bands Multipliers** | 1×, 2×, 3× | Standard deviation multiples for intraday bands.
| **VWAP Daily Reset** | Enabled | Resets VWAP at the start of each trading day.
| **EMA Lengths** | 9, 13, 20, 33, 50 | Short, medium, and long-term EMAs to track intraday trend. |
| **Enable Bearish Signals** | True | Allows detection of bearish parabolic moves. |
|

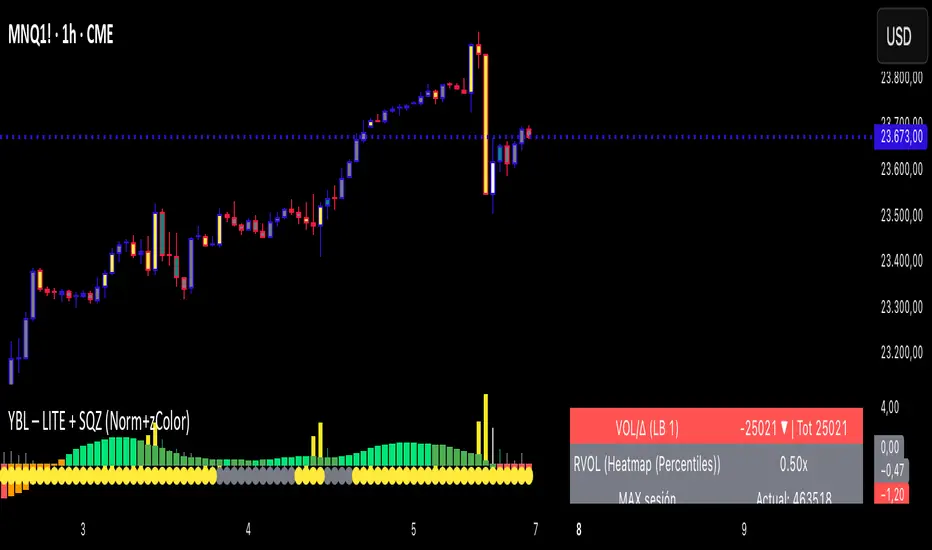
YBL – LITE HUD (Vol/Δ + RVOL + Squeeze) + ADV📌 Description – YBL – LITE HUD (Vol/Δ + Heatmap RVOL + Squeeze) + ADV
The YBL – LITE HUD is a compact yet powerful dashboard built for traders who value clarity and precision without sacrificing depth.
🔹 Vol/Δ (Volume Delta): highlights the imbalance between buyers and sellers in real time, exposing absorption and institutional pressure.
🔹 Heatmap RVOL: transforms relative volume into a dynamic heatmap, emphasizing unusual activity compared to historical averages.
🔹 Squeeze Momentum: detects volatility compression phases and signals potential breakout opportunities.
🔹 Normalization (z-score): all calculations are scaled for consistent comparison, with colors mapped to zVol intensity for intuitive reading.
🔹 ADV (Average Daily Volume): provides context with daily average volume benchmarks to validate the true strength of moves.
👉 The result is a lightweight, visual HUD designed for scalping and intraday trading, combining order flow, relative volume, and statistical context into a single glance.
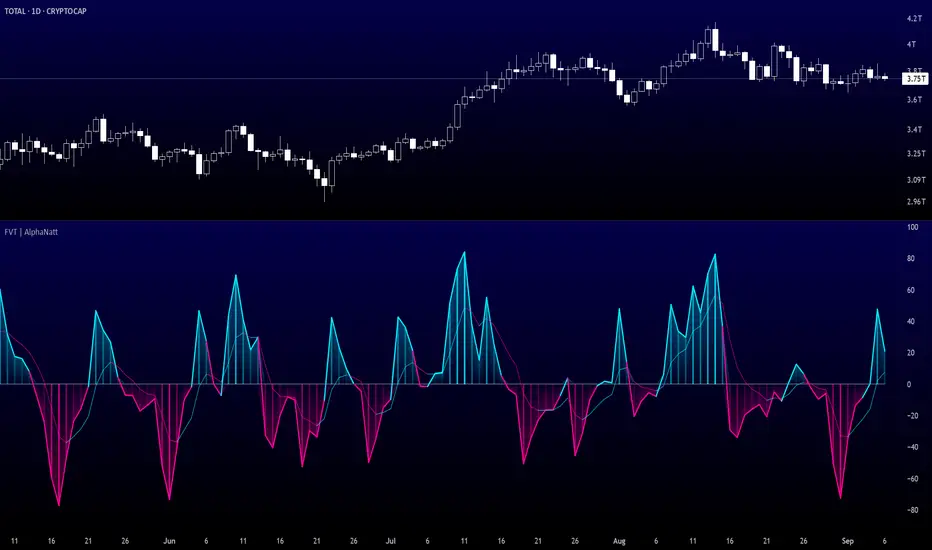
Fisher Volume Transform | AlphaNattFisher Volume Transform | AlphaNatt
A powerful oscillator that applies the Fisher Transform - converting price into a Gaussian normal distribution - while incorporating volume weighting to identify high-probability reversal points with institutional participation.
"The Fisher Transform reveals what statistics professors have known for decades: when you transform market data into a normal distribution, turning points become crystal clear."
━━━━━━━━━━━━━━━━━━━━━━━━━━━━━━━━━━━━━━━━
🎲 THE MATHEMATICS
Fisher Transform Formula:
The Fisher Transform converts any bounded dataset into a Gaussian distribution:
y = 0.5 × ln((1 + x) / (1 - x))
Where x is normalized price (-1 to 1 range)
Why This Matters:
Market extremes become statistically identifiable
Turning points are amplified and clarified
Removes the skew from price distributions
Creates nearly instantaneous signals at reversals
Volume Integration:
Unlike standard Fisher Transform, this version weights price by relative volume:
High volume moves get more weight
Low volume moves get filtered out
Identifies institutional participation
Reduces false signals from retail chop
━━━━━━━━━━━━━━━━━━━━━━━━━━━━━━━━━━━━━━━━
💎 KEY ADVANTAGES
Statistical Edge: Transforms price into normal distribution where extremes are mathematically defined
Volume Confirmation: Only signals with volume support
Early Reversal Detection: Fisher Transform amplifies turning points
Clean Signals: Gaussian distribution reduces noise
No Lag: Mathematical transformation, not averaging
━━━━━━━━━━━━━━━━━━━━━━━━━━━━━━━━━━━━━━━━
⚙️ SETTINGS OPTIMIZATION
Fisher Period (5-30):
5-9: Very sensitive, many signals
10: Default - balanced sensitivity
15-20: Moderate smoothing
25-30: Major reversals only
Volume Weight (0.1-1.0):
0.1-0.3: Minimal volume influence
0.5-0.7: Balanced price/volume
0.7: Default - strong volume weight
0.8-1.0: Volume dominant
━━━━━━━━━━━━━━━━━━━━━━━━━━━━━━━━━━━━━━━━
📊 TRADING SIGNALS
Primary Signals:
Zero Cross Up: Bullish momentum shift
Zero Cross Down: Bearish momentum shift
Signal Line Cross: Early reversal warning
Extreme Readings (±75): Potential reversal zones
Visual Interpretation:
Cyan zones: Bullish momentum
Magenta zones: Bearish momentum
Gradient intensity: Strength of move
Histogram: Raw momentum power
━━━━━━━━━━━━━━━━━━━━━━━━━━━━━━━━━━━━━━━━
🎯 OPTIMAL USAGE
Best Market Conditions:
Range-bound markets (reversals clear)
High volume periods
Major support/resistance levels
Divergence hunting
Trading Strategies:
1. Extreme Reversal:
Enter when oscillator exceeds ±75 and reverses
2. Zero Line Momentum:
Trade crosses of zero line with volume confirmation
3. Signal Line Strategy:
Early entry on signal line crosses
4. Divergence Trading:
Price makes new high/low but Fisher doesn't
━━━━━━━━━━━━━━━━━━━━━━━━━━━━━━━━━━━━━━━━
Developed by AlphaNatt | Quantitative Trading Systems
Version: 1.0
Classification: Statistical Transform Oscillator
Not financial advice. Always DYOR.
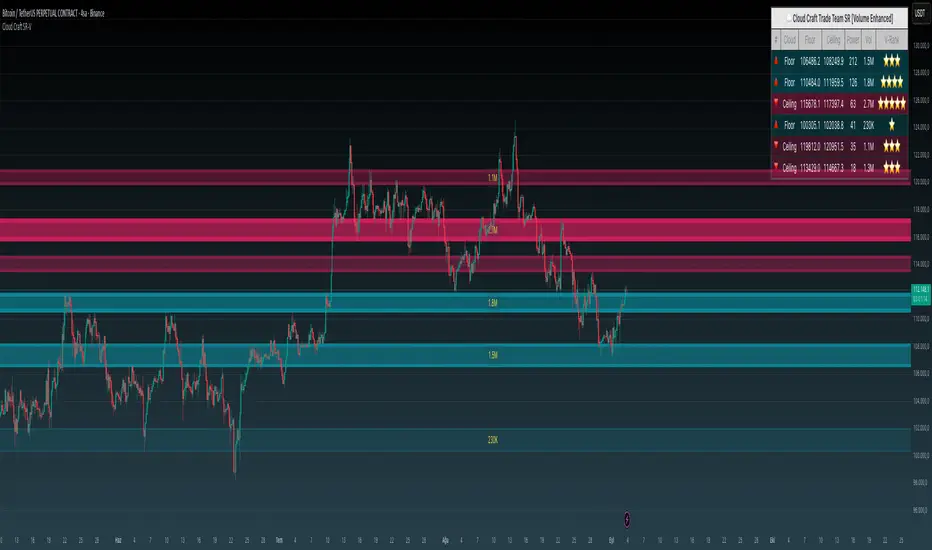
Cloud Craft SR [Volume Enhanced Edition]Cloud Craft SR - Advanced Support & Resistance System
Short Description:
Advanced cloud-based support & resistance indicator with volume analysis. Features dynamic zones, multi-timeframe analysis, and adaptive visual themes for different chart backgrounds.
Full Description:
Cloud Craft SR is an advanced support and resistance detection system that combines price action analysis with volume dynamics to identify high-probability trading zones.
🎯 Key Features:
Smart Zone Detection: Automatically identifies and ranks support/resistance zones based on historical price action
Volume Integration: Enhanced zone strength calculation using volume-weighted analysis
Multi-Timeframe Analysis: Configurable timeframe selection for deeper market structure analysis
Adaptive Visual Themes: Three color schemes optimized for white, black, and gray chart backgrounds
Dynamic Cloud Visualization: Visual representation of zone strength through opacity and border width
Real-Time Information Panel: Live zone data with volume rankings and strength metrics
Breakout Detection: Volume-confirmed breakout signals for enhanced reliability
📊 How Power & Volume Are Calculated:
Power Calculation:
Power represents the strength of each support/resistance zone based on:
Pivot Points: Number of price reversals at the zone (each pivot = 20 base points)
Touch Count: How many times price has tested the zone
Volume Weight: If volume analysis is enabled, zones with higher volume get multiplied strength
Example:
Zone has 3 pivot points = 60 base points
Price touched the zone 5 times = +5 points
Total base strength = 65
If volume at this zone is 1.5x average = 65 × 1.5 = 97.5 Power
Display Power = 97.5 ÷ 10 = 9.8 (shown as 10 in panel)
Volume Integration:
Collects volume data at each pivot point
Compares zone volume to average volume
Applies multiplier (default 1.5x) to strengthen high-volume zones
Volume Rank shows relative volume importance (⭐ to ⭐⭐⭐⭐⭐)
Visual Representation:
Higher Power = Thicker borders
Higher Volume = Less transparency (more solid appearance)
Top zones are displayed with strongest at top of panel
⚙️ Customization Options:
Cloud Timeframe (3min to Monthly)
Analysis Depth (100-500 bars)
Zone Sensitivity Control (2-12%)
Strength Filter Settings (min touches required)
Visual Style Selection
Volume Analysis Toggle
Panel Position & Theme
📈 How It Works:
The indicator analyzes historical price pivots to identify areas where price has repeatedly found support or resistance. These zones are then weighted by volume activity to determine their relative strength. Stronger zones appear more prominent visually, helping traders quickly identify key levels.
💡 Best Use Cases:
Identifying key support/resistance levels for entry/exit points
Confirming breakouts with volume analysis
Setting stop-loss and take-profit levels
Multi-timeframe confluence analysis
Risk management and position sizing
Default Settings Optimized For: 4H timeframe analysis with 250-bar lookback period
Why Protected Source?
This indicator uses proprietary algorithms for:
- Advanced pivot detection with volume weighting
- Dynamic zone strength calculation combining multiple factors
- Adaptive visual rendering based on volume and strength metrics
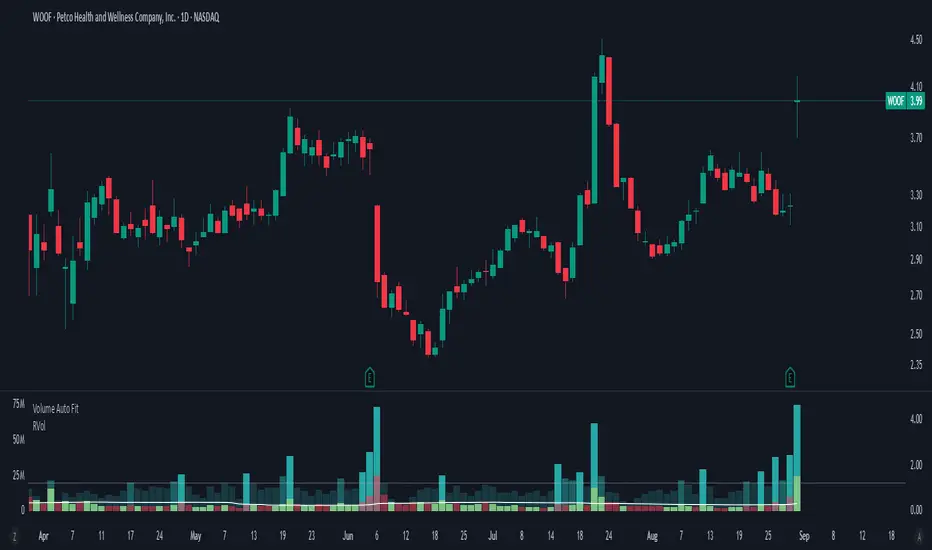
Volume Auto FitThis does nothing more than decreasing the size of (absolute) volume candles a bit, in order to allow showing candles with "Absolute" volume and Relative volume inside of the same panel - to save space.
I want to see both because:
Relative volume indicates higher activity than usual
Absolute volume helps with "Volume Price Analysis"
On the 5m you don't need "Volume Auto fit", but can just use usual "Volume" and it will look fine.
For the 1D I've created this one though, since RVol can be gigantic there sometimes.
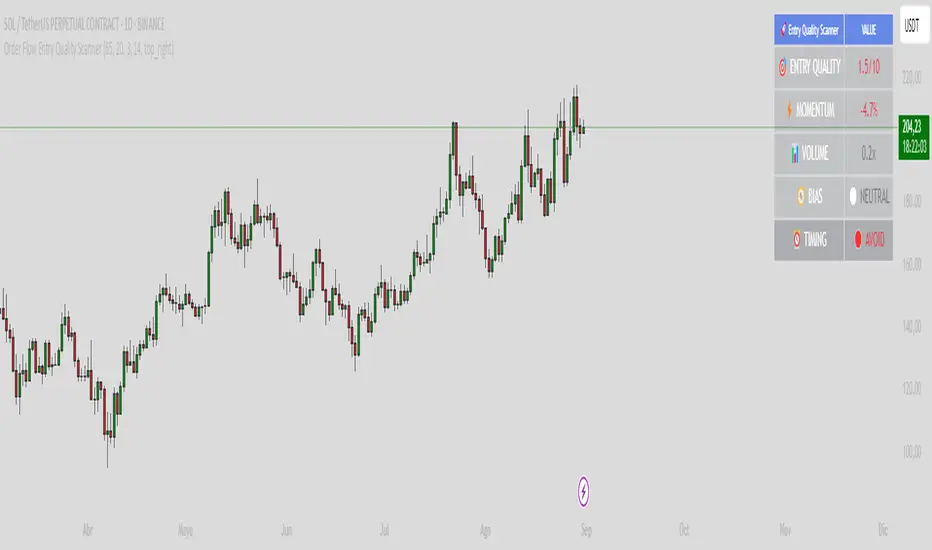
Order Flow Entry Quality ScannerOrder Flow Entry Quality Scanner
The order flow entry quality scanner is an educational technical analysis indicator designed to help traders evaluate the quality of potential entry points based on multiple technical factors. This indicator combines momentum, volume, delta analysis, and trend evaluation to provide an objective scoring system for market conditions.
Key Features
Comprehensive scoring system (0-10)
- momentum analysis: Evaluates price acceleration over recent bars
- volume delta: Measures buying vs selling pressure
- volume analysis: Compares current volume with historical averages
- vwap position: Determines price position relative to vwap
Advanced filters
- rsi filter: Optional to avoid overbought/oversold conditions
- value area filter: Helps identify fair price zones
- confluence analysis: Detects when multiple factors align
Clear visualization
- information table: Shows key metrics in real-time
- color coding: Intuitive system (green=favorable, yellow=caution, red=avoid)
- timing signals: Indicates when to consider, wait, or avoid entries
Configurable Parameters
Main configuration
- signal sensitivity (0-100): Adjusts overall scanner sensitivity
- volume periods(5-50): Defines period for volume analysis
- momentum bar (2-10): Number of bars for momentum calculation
Advanced filters
- rsi filter: Enable/disable rsi filtering
- rsi period (5-30): rsi period configuration
- value area filter: Enable value area analysis
Visual options
- show table: Enable/disable information table
- table position: Select chart location
Technical Calculations
Delta analysis
Calculates the difference between bullish and bearish volume based on tick direction to estimate buying/selling pressure.
Momentum acceleration
Measures the rate of price change over a specific period to identify acceleration or deceleration in movement.
Relative volume
Compares current volume with moving average to identify unusual activity.
Price efficiency
Evaluates how efficiently price moves within the bar's range.
Alert System
The indicator includes alerts for:
- High-quality bullish entries
- High-quality bearish entries
- Bullish factor confluence
- Bearish factor confluence
Recommended Usage
This indicator is an educational tool for technical analysis. It does not constitute financial advice nor guarantees results. Users should:
- Use it as part of a broader trading strategy
- Combine with other analysis methods
- Practice proper risk management
- Perform backtesting before live use
- Consider market conditions and fundamental news
Disclaimer
- educational purposes only: This indicator is designed for technical analysis learning
- no guarantees: Past results do not guarantee future performance
- risk warning: Trading involves risk of capital loss
- own decision: Trading decisions are solely the user's responsibility
- complementary analysis: Should be used alongside other analysis methods
- Works on all timeframes
- Compatible with all financial instruments
Always remember to do your own research and consult with financial professionals before making investment decisions.
Ludvig Indicator PROThe Ludvig Indicator is designed to identify high-probability breakout setups by combining trend, volume, volatility, and relative strength filters. It helps you enter stocks (or ETFs/crypto) when institutional money is likely flowing in, while avoiding false breakouts and weak trends.
🔑 Core Features
Zero-Lag EMA (ZLEMA)
Faster, less lagging trend detection compared to traditional EMAs.
Used as the basis for dynamic ATR bands.
ATR Volatility Bands
Adaptive bands based on the Average True Range (ATR).
Define the zone where price must close outside to confirm trend strength.
Breakout Confirmation
Requires price to close above recent highs (lookback configurable).
Ensures signals are “true breakouts,” not just noise around moving averages.
Volume Filter (Relative Volume)
Validates breakouts with significantly higher volume than average.
Prevents low-liquidity signals from triggering.
Trend Strength (ADX)
Built-in ADX calculation ensures only strong, trending moves are considered.
Default filter: ADX ≥ 18 (configurable).
Relative Strength vs. Benchmark
Compares the asset’s momentum against a benchmark (default: SPY).
Only signals when the asset is outperforming the benchmark.
Useful for sector rotation and picking leaders instead of laggards.
Alerts & Signals
Breakout entries are marked with small green triangles.
Built-in alerts for automated notifications (TradingView alerts).

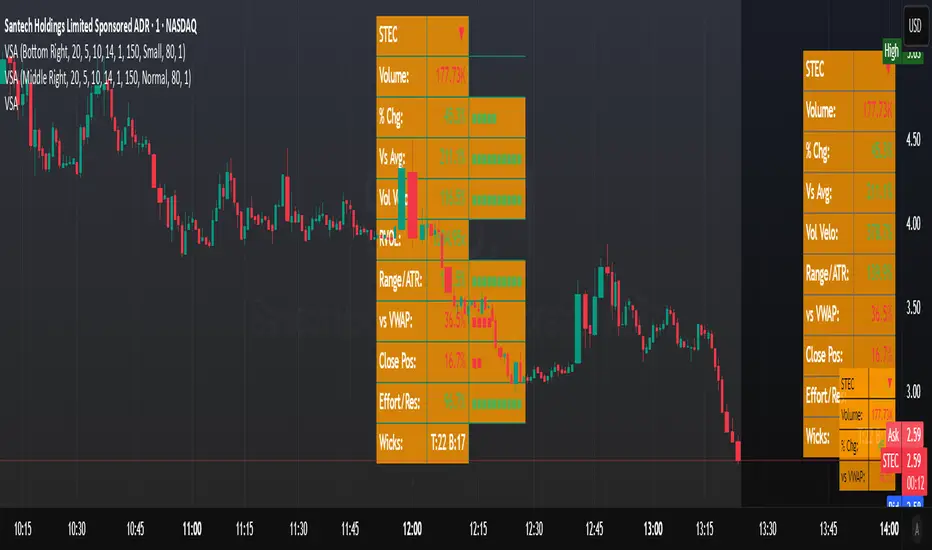
VSA - The Volume HUDVSA Volume HUD: Your At-a-Glance Volume Dashboard
Tired of cluttered charts with multiple indicators taking up screen space?
The VSA Volume HUD is a clean, powerful, and fully customisable Heads-Up Display that puts all the critical volume and price action data you need into one compact box, right on your chart.
Designed for traders who rely on Volume Spread Analysis (VSA), this tool helps you instantly gauge the strength, conviction, and context behind every price move as it happens.
Key Features
This indicator isn't just about showing the current volume; it provides a comprehensive, real-time analysis of the market's activity.
Real-time VSA Dashboard: A persistent on-screen table that updates with every tick, giving you instant feedback without needing to look away from the price. The HUD is fully draggable (hold Ctrl/Cmd + click and drag) to place it anywhere you like.
Essential Volume Metrics:
Current Volume: Displayed in a clean, abbreviated format (e.g., 1.25M for millions, 54.3K for thousands).
% Change (vs. Previous Bar): Instantly see if volume is expanding or contracting.
Vs Short-Term Average: Compare the current bar's volume to a moving average to spot unusual spikes.
Volume Velocity: Measures the rate of change in volume over a short period, helping you spot acceleration or deceleration in market interest.
Relative Volume (RVOL): See how the current volume compares to the average for that specific time of day, perfect for identifying abnormally high or low activity.
Price Action & Volatility Context:
Range vs. ATR: Quickly determine if the current bar's volatility is expanding or contracting compared to the recent average.
Price vs. VWAP: See how far the current price has deviated from the session's Volume-Weighted Average Price, a key level for institutional traders.
Deep Customization is Key
Tailor the HUD to perfectly match your trading style and chart aesthetic.
Display & Layout:
Compact Mode: Remove the metric labels for a sleek, minimalist view that saves screen space.
Bar Meters: Enable optional visual bars next to key metrics for a quick, graphical representation of strength.
Total Control: Toggle every single metric on or off to build the exact dashboard you need. Adjust text size, position, and background opacity with ease.
Smart Coloring & Visual Alerts:
Advanced VSA Coloring: This isn't just about up/down candles. The script intelligently colors volume based on confluence. It highlights increasing volume on a strong up-bar (bullish confirmation) or increasing volume on a down-bar (potential climax or distribution), giving you a deeper VSA context.
High Volume Highlight: Make standout bars impossible to miss! The entire HUD background can change color automatically when volume surges past a custom threshold (e.g., over 150% of the average), instantly drawing your attention to critical moments.
Full Color Customization: Change every color to match your chart's theme, including separate colors for bullish/bearish moves, the background, and the border.
How to Use It
The VSA Volume HUD is a powerful confirmation tool. Use it to:
Confirm Breakouts: Look for a spike in Volume vs. Average and RVOL as price breaks a key level.
Spot Exhaustion: Notice high volume on a narrow-range candle after a long trend, visible through the Range/ATR metric.
Gauge Conviction: Use the Advanced Coloring to see if volume is supporting the price move (e.g., green volume on a green candle) or diverging from it.
[Teyo69] T1 Short & Long Covering📘 Overview
The Short & Long Covering indicator is designed to help traders detect potential absorption candles and short-covering traps using a combination of normalized volume behavior and price exhaustion logic.
It visualizes possible long opportunities after sell-offs and short traps after price rallies—ideal for traders who want to anticipate reversals based on volume structure.
🧩 Features
📈 Detects rising price with falling volume → potential short covering
📉 Detects falling price with falling volume → potential long absorption
🔍 Flags volume spike conditions using normalized volume vs MA
🔵 Plots “L” (Long Covering) below bars
🔴 Plots “S” (Short Trap) above bars
Customizable pivot lookback and exhaustion period
⚙️ How to Use
Use "L" markers as possible long re-entry points after shakeouts
Use "S" markers to watch for failed rallies or bull traps
Combine with S/R zones or trend filters to confirm
Works well in conjunction with Wyckoff-style market logic or volume spread analysis (VSA)
🔧 Configuration
Price movement Lookback: Sets how many bars to compare for trend detection
Exhaustion Lookback: Defines the recent window to confirm price is exhausted
Normalized Volume MA Length: Used to determine volume spikes relative to average
⚠️ Limitations
Not a standalone signal — should be used with confluence (e.g., support/resistance, trend filters)
Best for spotting potential reversals, not trend-following entries
May generate false signals in low volume chop or news spikes
💡 Advanced Tips
Combine with a trend filter like appropriate EMA to avoid counter-trend setups
Use with a support/resistance script to find confluence zones
Watch for clustered L/S signals — multiple signals in a zone may show strong absorption or distribution
📝 Notes
Signal logic is based on volume exhaustion and price movement divergence
Normalized volume helps compare relative volume across time
“Spike” condition triggers only when volume exceeds 100% of its moving average
🚫 Disclaimer
This script is for educational purposes only. It does not constitute financial advice. Always do your own research and use proper risk management.

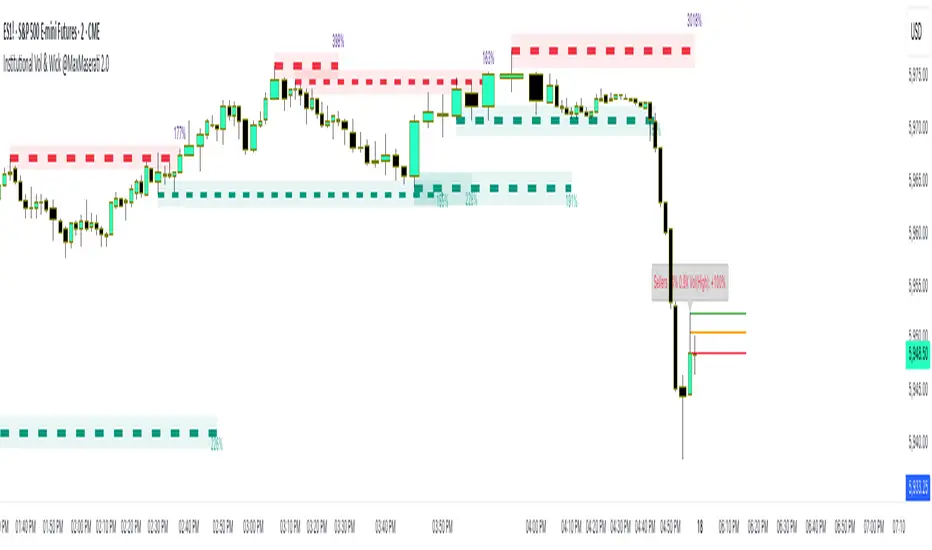
Institutional Volume Toolkit & Automatic Wick @ MaxMaserati 2.0Institutional Volume Toolkit with Automatic Wick Analyzer @ MaxMaserati 2.0
Overview
This advanced technical indicator combines institutional volume analysis with precise wick detection to reveal hidden market dynamics driving price action. Designed for serious traders who recognize that volume is the fuel behind meaningful price movements, this toolkit identifies key support/resistance zones created by significant institutional activity while simultaneously analyzing candlestick wicks to detect buyer/seller dominance.
Key Features
Volume Defense Levels
Institutional Support/Resistance Detection: Automatically identifies price levels where significant volume occurred during swing points
Dynamic Strength Visualization: Defense level thickness varies based on relative volume importance
Volume % Labels: Clearly shows the strength of each defense level relative to average volume
Adaptive Coloring: Green for buyer defense (support), red for seller defense (resistance)
Wick Analysis System
Smart Wick Detection: Analyzes upper and lower wicks to identify real-time buying and selling pressure
Automatic Dominance Calculation: Determines whether buyers or sellers are dominant at key price points
Multi-Line Analysis: Displays 3-line sets at critical wick areas for precise entry/exit signals
Volume-Enhanced Signals: Combines wick analysis with volume comparison for stronger signals
Trading Applications
Support/Resistance Trading: Identify high-probability bounce or reversal zones created by institutional volume
Break & Retest Strategies: Trade with confidence when price retests broken volume levels
Divergence Detection: Spot divergences between price action and institutional commitment
Swing Trading Setup: Perfect for identifying optimal swing trade entries with favorable risk/reward
Trend Confirmation: Validate trend strength by assessing institutional participation
Setup Guidelines
Volume Defense Levels: Customize volume lookback and threshold to match your timeframe
Wick Analysis: Set filters (wick-to-body ratio, volume percentage, dominance) to eliminate noise
Visual Settings: Adjust colors and label sizes to match your chart preferences
Combine Timeframes: Use on higher timeframes for strategic levels, lower timeframes for entries
This indicator combines sophisticated volume analysis with candlestick psychology, providing a complete toolkit for identifying institutional activity where smart money is actively defending price levels. By revealing the hidden forces driving market movements, it offers a significant edge for traders seeking to align their positions with institutional flow.
Enhanced Volume w/ Pocket Pivots, Milestones & LiquiditySure! Here’s a professional and clear **description** you can use when saving or publishing the script on TradingView:
---
## 📄 Script Description: *Enhanced Volume w/ Pocket Pivots, Milestones & Liquidity*
This custom volume indicator enhances the default volume view by combining key institutional-level insights into a single tool. It highlights meaningful volume activity, liquidity conditions, and milestone events to help traders better understand accumulation/distribution and smart money participation.
### 🔍 Features:
* **Color-coded volume bars**:
* 🔵 **Pocket Pivot Volume (PPV)**: Up-day with volume > highest down-day volume of last 10 bars.
* 🟢 **Up Volume**: Up-day with volume > 50-day average.
* 🔴 **Down Volume**: Down-day with volume > 50-day average.
* 🟠 **Dry Volume**: Low-volume bars < 20% of 50-day average.
* ⚫ **Neutral/Other bars**: No significant signal.
* **Volume Milestones**:
* **HVE**: Highest volume ever (20 years lookback).
* **HVY**: Highest volume in the past 1 year (252 bars).
* **HVQ**: Highest volume in the past quarter (63 bars).
* **Projected Volume**:
* Real-time estimate of end-of-day volume based on elapsed session time.
* **Liquidity Metrics**:
* Displays current and 50-day average dollar volume.
* Estimates 1-minute liquidity for large-position feasibility.
* **Relative Volume Label**:
* Displays how today’s volume compares to the 50-day average.
* **Alerts Included**:
* Set alerts for HVE, HVY, and HVQ to catch key breakout or climactic volume events.
---
### 🧠 Ideal For:
* Growth stock traders
* Volume/price analysts
* Intraday & swing traders
* Institutions or prop traders needing liquidity benchmarks
---
Let me know if you'd like a short or promotional version (for sharing with others).

Capital Flow StrengthCapital Flow Strength Indicator Guide
This is a comprehensive technical indicator that measures capital flow into or out of an asset, combined with volume analysis. Here's how to use it effectively:
Basic Understanding
The indicator shows capital flow strength on a scale from -100 to +100
Positive values (green) indicate money flowing into the asset
Negative values (red) indicate money flowing out
The blue/gray volume bars show relative volume compared to recent average
Key Components
Capital Flow Line
Green line above zero: Buying pressure dominates
Red line below zero: Selling pressure dominates
Crossing zero: Potential shift in market sentiment
Reference Lines
0 line: Neutral balance between buyers and sellers
+50 line: Strong buying pressure
-50 line: Strong selling pressure
Volume Strength Bars
Blue bars: Volume exceeding threshold (currently 1.5x average)
Gray bars: Normal volume levels
Taller bars: Higher relative volume
Trading Applications
Entry Signals
Strong buying setup: Capital flow above +50 with blue volume bars
Strong selling setup: Capital flow below -50 with blue volume bars
Confirmation Tool
Use with price action and other indicators for confirmation
Strong readings are more reliable when volume is higher than average
Divergence Analysis
Bullish divergence: Price making lower lows but capital flow making higher lows
Bearish divergence: Price making higher highs but capital flow making lower highs
Customization Options
Length (14): Adjust the calculation period
Volume Threshold (1.5): Modify sensitivity to volume spikes
Alert Conditions
The indicator has two built-in alerts:
"Strong Capital Inflow" - triggers when flow > 50 with high volume
"Strong Capital Outflow" - triggers when flow < -50 with high volume
These alerts can help you identify significant buying or selling pressure as it emerges.

MissedPrice Volume Method[KiomarsRakei]█ Core Concept:
This script detects price zones that are highly likely to be revisited — areas where price moved too quickly to fully fill market activity. Using sharp volume shifts and volatility filters, the script identifies these “missed” levels and generates signals pointing toward them.
Signals are generated before price reaches the zone, allowing you to analyze price behavior both before and after the zone is touched. These zones often act like magnets for price, making them ideal for short-term.
Examples of signals and high hit rate of Missed zones
█ How It Works:
The script monitors 3-candle volume and price behavior to detect moments where volume accelerates abnormally compared to recent averages. When a potential missed zone is found and price hasn’t revisited it yet, a signal is created in advance, pointing to that zone as a likely future target.
█ Features:
Zone Visualization: Dynamic boxes show price targets based on missed volume areas.
Pre-Zone Signals: Alerts fire before price returns, offering early trade setups.
Stat Tracking System: Automatically logs signals, win rate, and average profit.
Live Performance Table: On-chart stats including hit/miss breakdown and late-return analysis.
Works on All Markets: Compatible with any chart that provides volume — crypto, forex, indices, or stocks.
A signal is considered successful when price touches the zone. However, not all zones are guaranteed to be revisited.
█ Key Inputs & Stats Table:
Volume Filters: Control signal sensitivity using min/max relative volume shift.
Zone & Line Settings: Adjust how long the zone stays visible and whether entry lines are drawn.
Custom Colors: Choose colors for buy/sell zones, lines, and visuals.
📊 Table Metrics:
Total Signals: Count of all generated signals.
Win Rate: % of signals where price returned to the zone (hit = touched the zone, regardless of timing).
Bad Signals: Signals that took too long to hit or were never hit.
Bad but Hit: Signals marked bad but eventually touched the zone.
Bad signals are marked in red. These indicate zones that price failed to reach within the expected time window, showing where the script identified a target that remained unfulfilled.

Titan X 📈 Titan X – Optimized Trend Strategy with Gradient ZLEMA, RMI, CCI, ROC, and Volume Confirmation
Titan X is a precision-engineered trend-following strategy designed for crypto markets and high-volatility assets. It is not just a combination of indicators, but a carefully constructed, non-repainting system where each component plays a specific role in confirming high-probability trade setups. The strategy detects strong directional moves, confirms them with momentum and volume, and manages trade exits without relying on traditional stop losses.
🔍 How the Indicators Work Together
✅ 1. ZLEMA Baseline + Gradient Filter
A Zero Lag Exponential Moving Average (ZLEMA) is used to track directional trend with minimal lag.
A gradient (slope) is calculated from the ZLEMA to measure trend acceleration. This confirms whether a trend is gaining strength or losing momentum.
Entries are only taken when the ZLEMA gradient exceeds a user-defined threshold, ensuring trades are only taken in strong, developing trends.
✅ 2. RMI – Relative Momentum Index (with Memory)
RMI captures sustained momentum direction over time.
It helps validate that price isn't just spiking, but truly trending.
Titan X uses RMI as a trend memory filter, requiring consistent momentum alignment before entry.
✅ 3. Momentum Timing – ROC + CCI
The Rate of Change (ROC) determines the strength and direction of recent momentum.
The Commodity Channel Index (CCI) checks price deviation from a moving average baseline, identifying whether momentum is aligned with market structure.
This combo prevents trades in weak, flat, or conflicting conditions.
✅ 4. Volume Spike Confirmation
Titan X uses a relative volume filter, requiring the current bar’s volume to exceed a moving average threshold.
This ensures trades are only triggered when there is clear breakout interest from market participants, helping avoid fakeouts and low-volume moves.
🎯 Trade Entry & Exit Rules
✅ Entry Conditions:
All five filters must align:
Trend direction (ZLEMA slope)
Momentum (ROC & CCI)
Trend memory (RMI)
Volume (Spike filter)
Trades are entered on the next bar after all confirmations, ensuring 100% non-repainting behavior.
✅ Take Profit System (Multi-Level TP):
TP1: Closes 50% of the position at a user-defined % gain (default: 2%)
TP2: Closes the remaining 50% of the position at a higher % gain (default: 4%)
Each TP is executed via limit order to ensure realistic and backtestable fills.
❌ No Stop Loss Used
Instead of using fixed stop losses, Titan X closes positions early when trend conditions weaken.
This dynamic exit logic is based on a reversal in ZLEMA gradient, which serves as a weak trend detection system.
⏱️ Cooldown Logic
A 1-bar cooldown is enforced between trades to avoid same-bar exit/entry violations on TradingView.
This improves execution accuracy and avoids overtrading on choppy price action.
📊 Real-Time Strategy Dashboard
Titan X includes a live dashboard that provides full transparency:
Current Position (Long / Short / Flat)
Entry Price
TP1 Hit? / TP2 Hit?
Bars Since Entry
Win Rate (%)
Profit Factor
Ideal for both manual monitoring and automated bot strategies.
🔔 Bot-Ready Multi-Exchange Alerts
Alerts can be configured for:
ENTER-LONG, ENTER-SHORT
EXIT-LONG, EXIT-SHORT
TP1 / TP2 targets
Messages are fully customizable and designed for platforms like:
WonderTrading
3Commas
TradingConnector
⚙️ Designed For:
Timeframes: 1H and 4H (optimized for crypto)
Markets: Altcoins, BTC/ETH, high-volatility pairs
Traders: Trend-followers, momentum scalpers, algo bot users
Goal: High accuracy entries, structured exits, zero repainting, and flexible trade management
⚠️ TradingView Disclosure
This strategy is provided for educational purposes only. It does not constitute investment advice, nor does it guarantee any returns. Trading carries risk; test thoroughly before using in live environments.

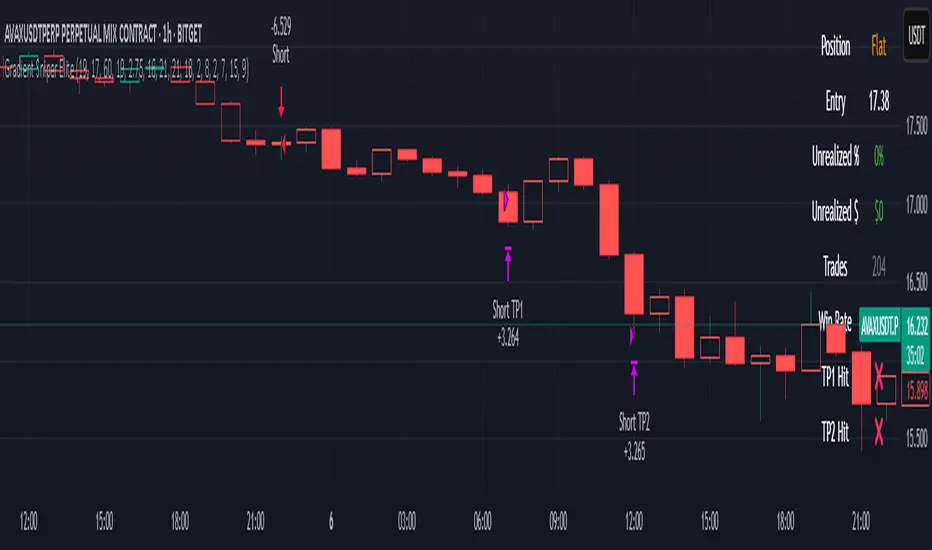
Gradient Sniper Elite🧠 Gradient Sniper Elite — Precision Trend Detection and Tactical Trade Execution for Crypto
Gradient Sniper Elite is a high-performance crypto trend strategy engineered for accuracy, adaptability, and smart execution on the 1-hour timeframe. This script is not just a mashup — it's a purpose-built system that combines trend, momentum, and volume filters in a structured and non-repainting framework designed for optimal entry and exit timing.
🔍 What Makes It Original?
This strategy combines several proven concepts into a unified, precision-calibrated trade engine:
✅ ZLEMA Gradient Filter: A slope-based trend filter that captures the direction and strength of momentum shifts without repainting.
✅ TEMA Confirmation: Triple EMA logic confirms trend acceleration or exhaustion by analyzing layered EMA cross-smoothing.
✅ RMI-Based Trend Direction: Replaces traditional RSI with a Relative Momentum Index (RMI), which smooths price momentum and avoids lag.
✅ ROC & Smoothed CCI: Dual momentum filters ensure that trades align with both velocity and structure of price moves.
✅ Volume Spike Filter: Filters out false breakouts and manipulation by confirming entries only during statistically significant volume surges.
✅ TP1/TP2 Split Take Profit Logic: 50% partial exit at TP1 and full exit at TP2. Ensures flexible profit-taking while maximizing trend continuation gains.
✅ Trend Weakness Exit: Trades are exited cleanly when the trend begins to weaken (as confirmed by RMI flip), preventing overstay and drawdown.
✅ 1-Bar Reversal Delay: The system enforces a 1-bar delay between a trade closure and any potential reversal entry, ensuring clean trend reversals and realistic live trading behavior.
✅ No Stop Loss: This strategy does not use a stop loss. Instead, it exits trades based on trend weakness or TP2 being hit. This avoids premature exits in volatile crypto environments, while maintaining controlled and dynamic trade management logic.
⚙️ How It Works
This strategy uses multi-layered confirmation:
Trend Structure
ZLEMA Gradient: Captures the slope of price action.
White Line + Fast/Slow Tether Lines: Define macro trend structure and act as dynamic S/R filters.
Momentum Alignment
Rate of Change (ROC): Measures directional velocity.
Smoothed CCI: Refines entry timing within the trend.
TEMA: Adds second-layer trend confirmation.
Volume Confirmation
Entry signals are validated by detecting relative volume spikes compared to a moving average baseline, avoiding entries on low-volume or fake breakouts.
Trade Management
Dynamic take-profits (TP1/TP2).
Immediate exit on trend weakening.
No same-bar entry/exit — reversal entries are delayed until after full exit confirmation.
No stop loss — trade management is handled via trend logic and take profit levels.
📊 Dashboard Overview
Gradient Sniper Elite includes a built-in dashboard in the top-right corner of the chart. It dynamically updates on each bar and shows:
📍 Position: Displays "Long", "Short", or "Flat" depending on the active trade
💰 Entry Price: The exact price where the trade was entered
📈 Unrealized %: Current profit/loss as a percentage
💵 Unrealized $: Estimated PnL in dollars, scaled to your backtest capital
📊 Trades / Win Rate: Live counter for total trades, win/loss count, and win rate
🎯 TP1 Hit / TP2 Hit: Shows ✅ or ❌ depending on whether each target level was reached during the current trade
This dashboard helps you monitor trade status, track live performance, and validate signal behavior in real time — all without repainting or relying on external tools.
📈 How to Use
Timeframe: Optimized for the 1-hour timeframe, but adaptable.
Asset Class: Primarily built for crypto markets, especially fast-moving alts like AVAX, LINK, QNT, etc.
Trade Mode: Supports long and short trades with clean reversal logic.
Dashboard: Live stats including position status, TP1/TP2 hit, win rate, and real-time PnL tracking.
Backtest Ready: Built with full compliance to TradingView backtest engine — results are realistic and match live-bar behavior.
⚠️ No Repainting — No Guesswork
Every element in this script is designed to work with confirmed bar data only. There is zero forward-looking logic. This makes Gradient Sniper Elite fully compatible with both backtesting and live algo execution.
🧩 Why This Isn’t Just a Mashup
Each indicator in this strategy has a specific role:
ZLEMA: Core trend slope engine.
TEMA: Trend reinforcement.
RMI: Directional decision layer.
CCI & ROC: Entry timing refinement.
Volume Filter: Risk filtering.
They’re not merged randomly, but combined in sequence to eliminate noise and optimize entries.
📌 Disclaimer
This script is for informational and educational purposes only. It does not constitute financial advice or a recommendation to buy or sell any asset. Always do your own research and use appropriate risk management when trading. Past performance does not guarantee future results.